Heterotrophic total ammonia nitrogen (TAN) management protocol for larval culture stages.
🧮 HeteroMight OS (Hatchery Calculator)
Open the precise sugar level and bicarbonate alkalinity management template to compute values automatically based on your tank volume, shrimp biomass & feeding.
Open HeteroMight OS →
🧮 Hatchery Brewing Calculator
Click here to enter your exact tank capacity volume and calculate jaggery and probiotic needs instantly.
Open Calculator →
1
Water Metric Analysis Ammonia Tracking
Testing Routine & Thresholds
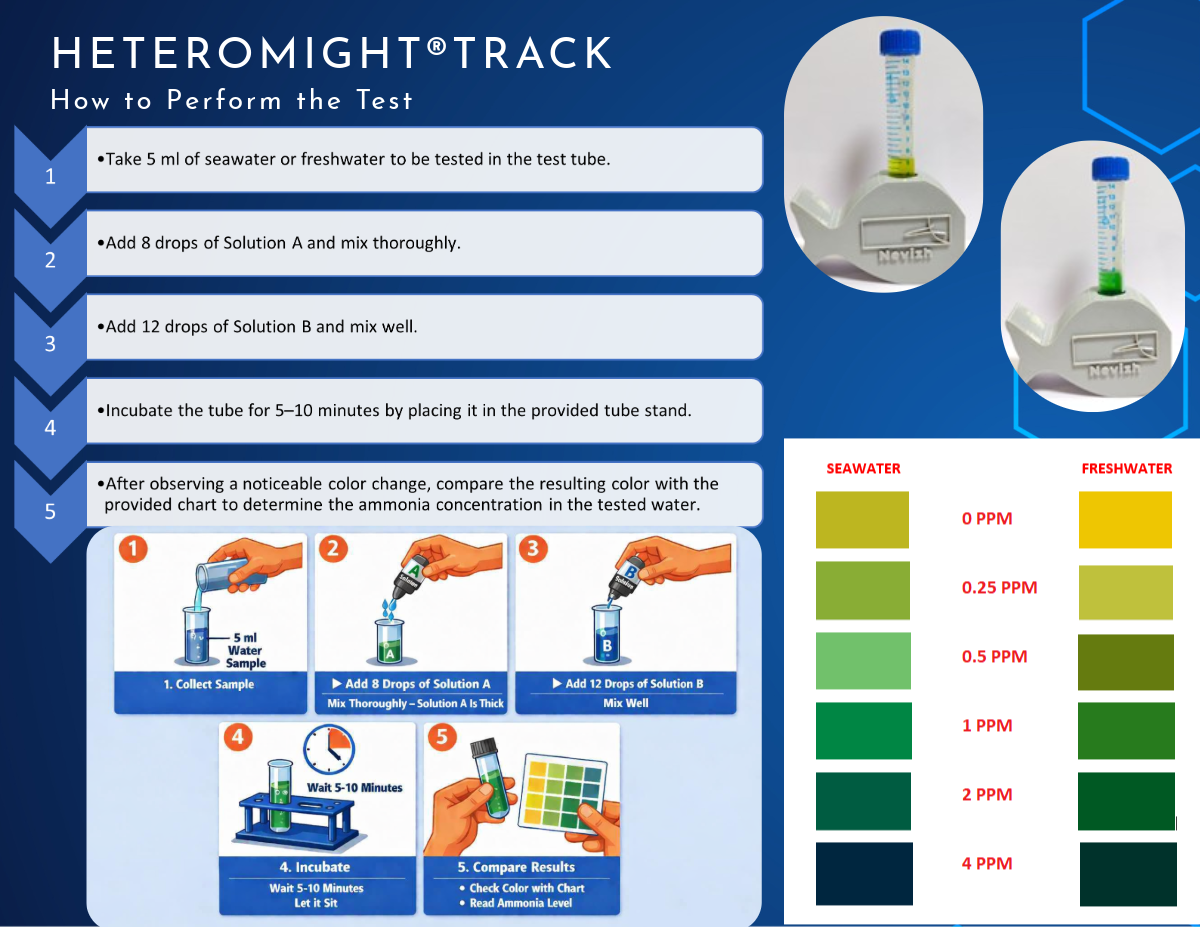
Monitor parameters using our HeteroMight Track salicylate chemistry test kit. Nitrogen peaks typically occur from the Mysis 1 stage onwards. Begin treatment if total ammonia nitrogen moves above 0.5 ppm.
2
Biomass Pre-Activation HETEROMIGHT™ : LEVERAGING ALTENATIVE AMMONIA UTILIZING PATHWAY
Proportions (Per 10-Ton Tank)
10 Liters treated seawater + 50 mL HeteroMight Probiotic (5 ppm) + 30 grams Jaggery (3 ppm).
Aeration Window
Submerge air stones into the vessel and maintain robust aeration for exactly 6 hours (± 1 hour).
Tank Delivery
Pour the entire brewed content unfiltered directly into the 10-ton rearing tank. Scale evenly for alternative sizes.
3
Sugar Application Assimilation Dosing
Carbohydrate Dosing
Apply pure table sugar at a recommended rate of 10 ppm (e.g., 100 grams of sugar per 10-ton tank volume) to drive assimilation kinetics. For complex bicarbonate and multi-parameter adjustments, reference the calculator link above.
4
Result Verification & Caution Notes Parameter Validation
Post-Treatment Testing
Re-test parameters after 8 hours using the HeteroMight Track kit to observe the targeted TAN drop.
Caution
Microbial Floc Formation: Biological ammonia sequestering converts dissolved nitrogen into harvestable bacterial cell mass (biofloc feed). Expect to observe superficial larval attachments during active cycles. These are non-pathogenic, natural behaviors that clear off cleanly after each individual moulting phase.
⚠️ Hatchery Operational Disclaimer: The dosing volumes and chronological paths listed above reflect metrics derived from controlled laboratory evaluation and commercial hatchery validation data. Actual biological needs, aggregation dynamics, and colony transformation speeds may vary depending on water conditions, native plankton loading, and local biosafety management. Consult a Nevizh technical expert for site-specific optimization.
Heterotrophic total ammonia nitrogen (TAN) management protocol for grow-out ponds.
🧮 Grow-out Ammonia & Carbon Calculator
Compute precise carbon-to-nitrogen balancing, Sugar & Bicarbonate dosing tailored for large grow-out ponds.
Open Farm Calculator →
🧮 Grow-out Brewing Calculator
Click here to enter your exact pond area (water depth 1-1.5 meter) to calculate farm inputs automatically.
Open Calculator →
1
Pond Timeline Verification Field Tracking
Ammonia Accumulation window
Pond ammonia levels typically show rising trends after 1 month of stocking due to increased feed loads & accumulated biomass. Monitor changes closely, using HeteroMight Track at lease twice a week.
2
Pond Probiotic Fermentation HETEROMIGHT™ : LEVERAGING ALTENATIVE AMMONIA UTILIZING PATHWAY
Input Ratios & Water Quality
Prepare 100 Liters of fresh bore water (salinity profile should preferably register ≥ 2 PPT and < 100 PPT) + 1 Liter of HeteroMight Probiotic + 600 grams of pure Jaggery.
Daytime Ambient Optimization
Execute brewing strictly during daytime hours when ambient temperatures are optimal. Keep the containment vessel covered securely for 8 hours.
Aeration & Broadcast Delivery
Provide continuous aeration if air stones are available. After 8 hours, pour the entire 100L mixture unfiltered directly into the pond water.
3
Result Verification Performance Monitoring
Expected Response
Perform post-application water analysis after 2 days. Expect to observe a significant downward drop in total ammonia (TAN) as heterotrophic bacterial population stabilize.
⚠️ Farm Operational Disclaimer: Grow-out application tracks, timeline metrics, and dosing rules are structured as per controlled condition data. Actual required inputs, system stabilization timelines, and microbial dominance curves can vary depending on feeding ratios, organic loading levels, aeration efficiency, and individual farm management protocols. Consult a Nevizh area representative for tailored site optimization plans.
Visual validations, test protocols, and field analytics for ammonia management systems. Click any image to expand.
HeteroMight® Track – Test Procedure & Color Reference
Official testing procedure and reference color chart for the HeteroMight® Track Total Ammonia Nitrogen (TAN) kit, covering reagent addition, incubation, and result interpretation for freshwater and seawater samples.
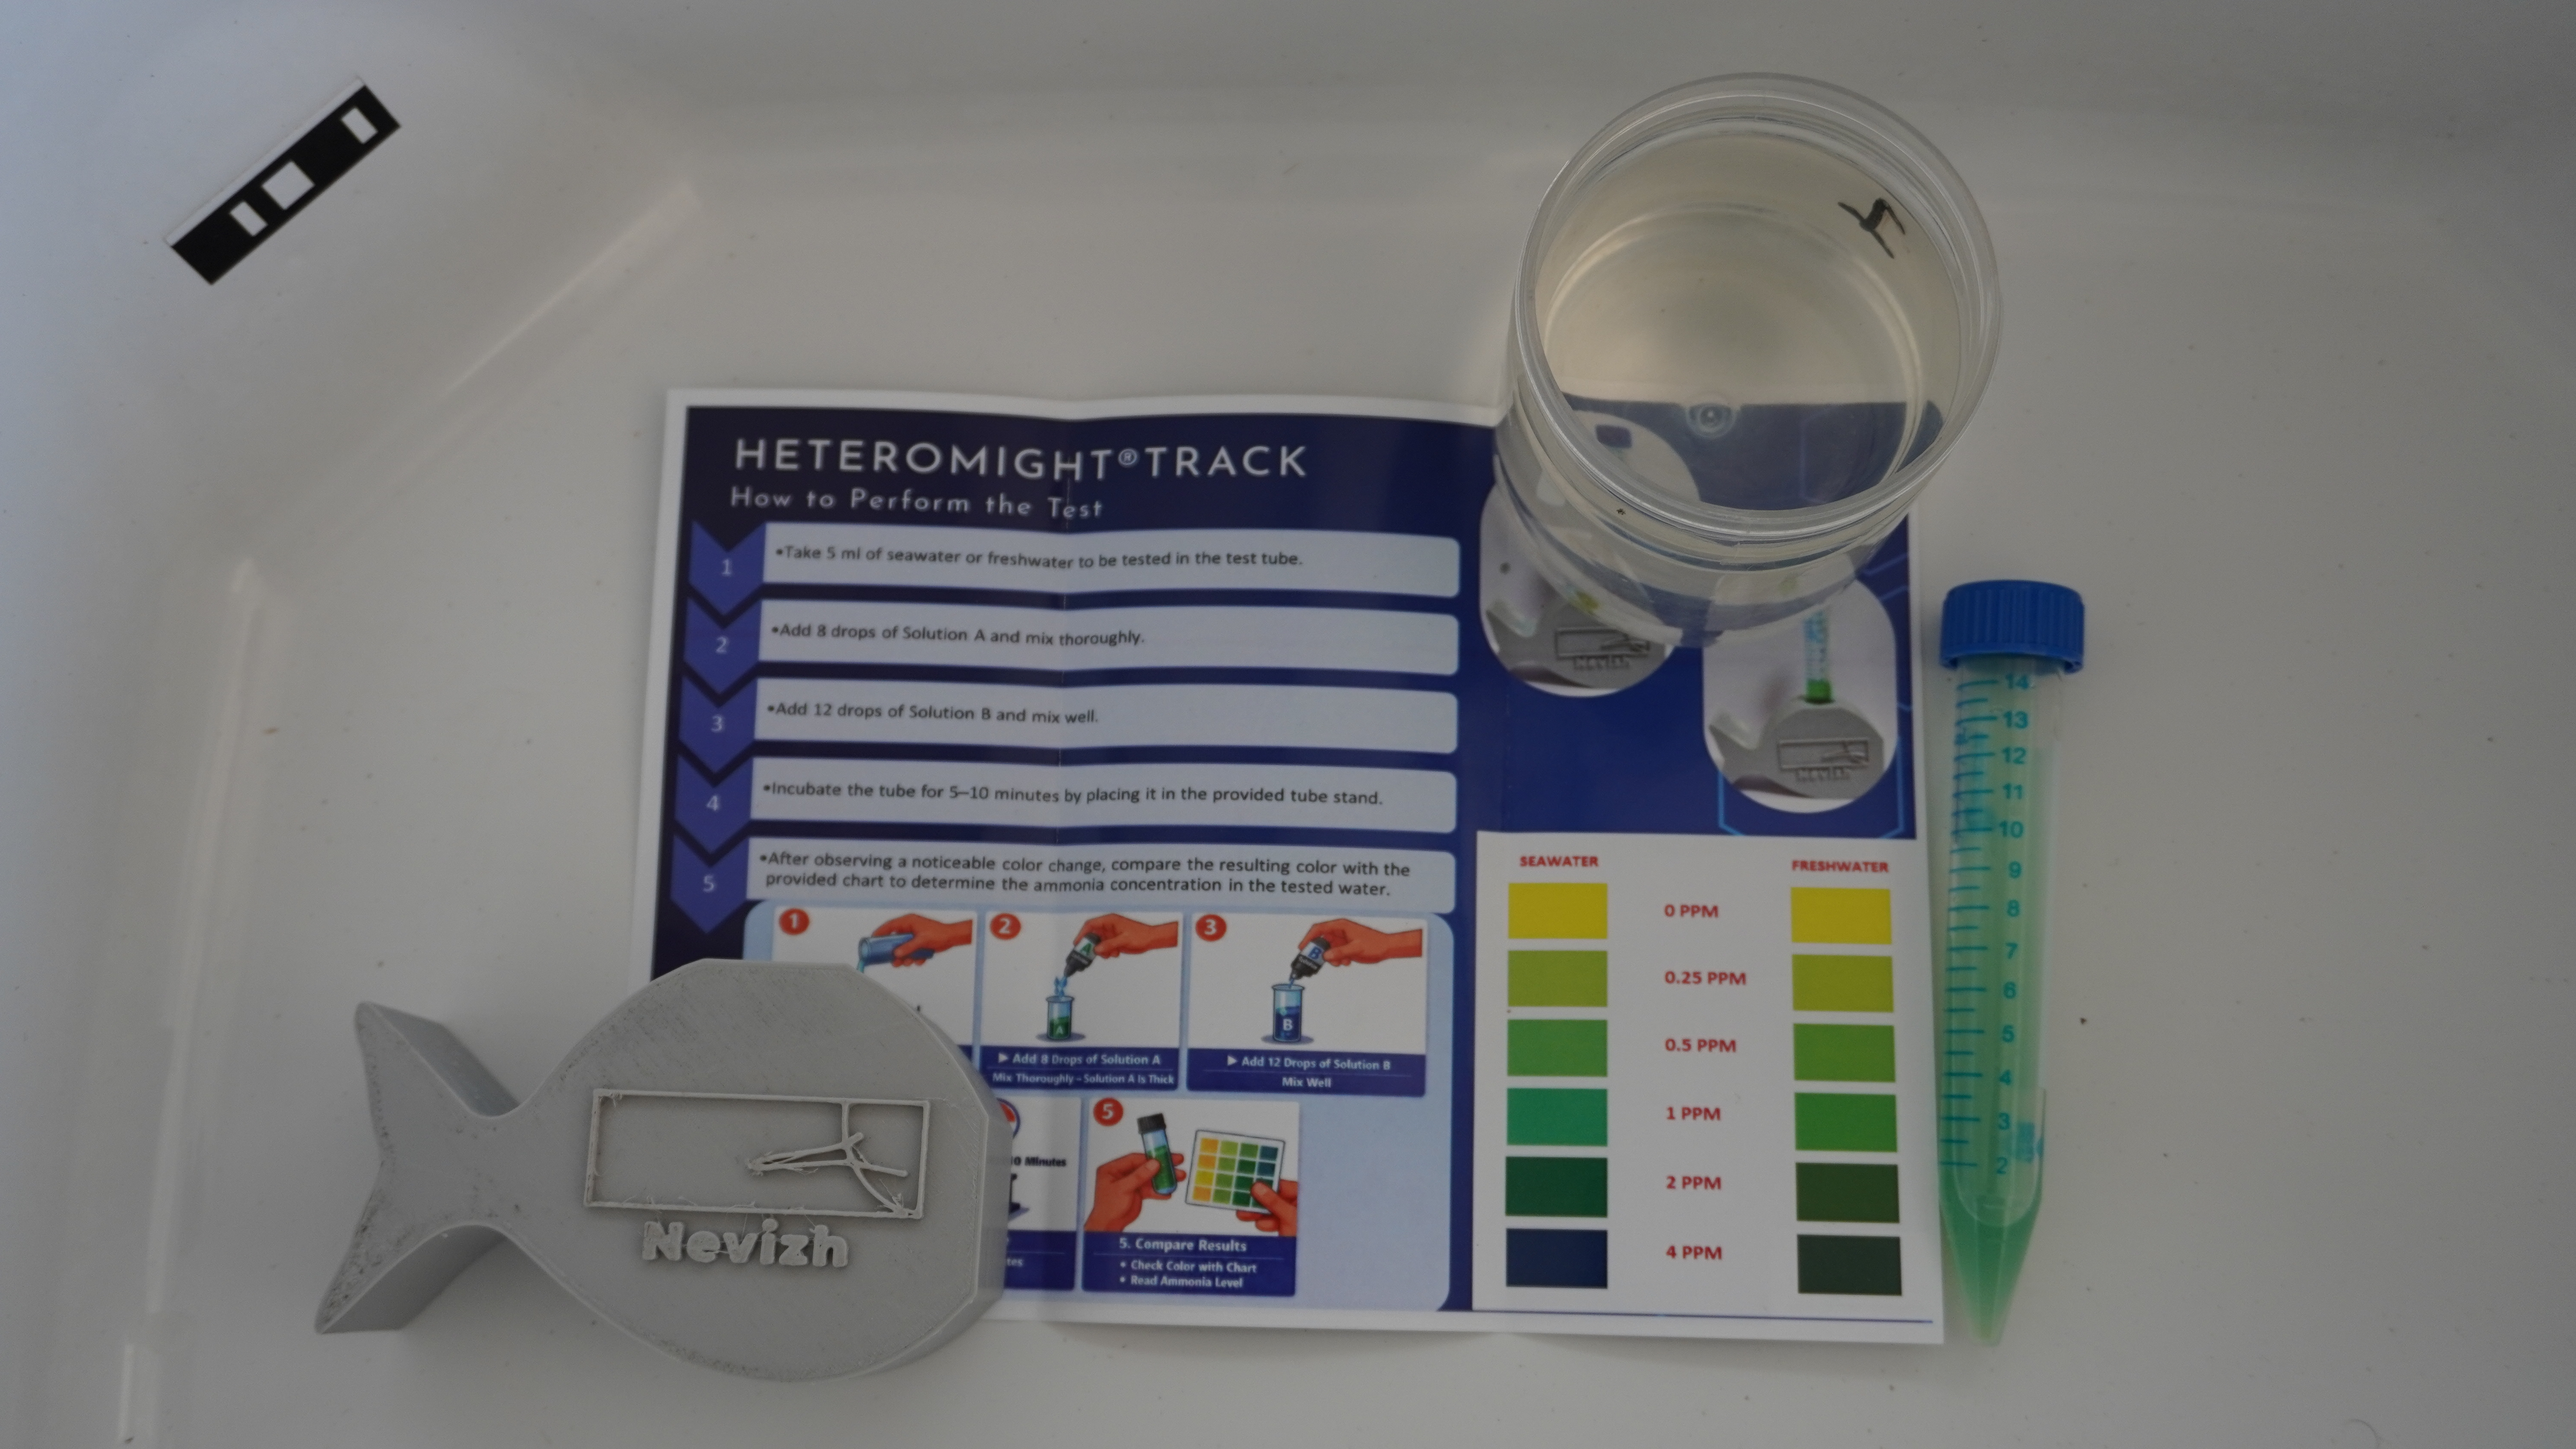
PL9 Shrimp Hatchery Water – Approximately 3 ppm TAN!
Water from a PL9 shrimp packing tank showing approximately 3 ppm TAN, nearly 7× higher than the recommended maximum 0.42 mg/L TAN for L. vannamei zoea larvae (Cobo et al., Aquaculture Research, 2014).
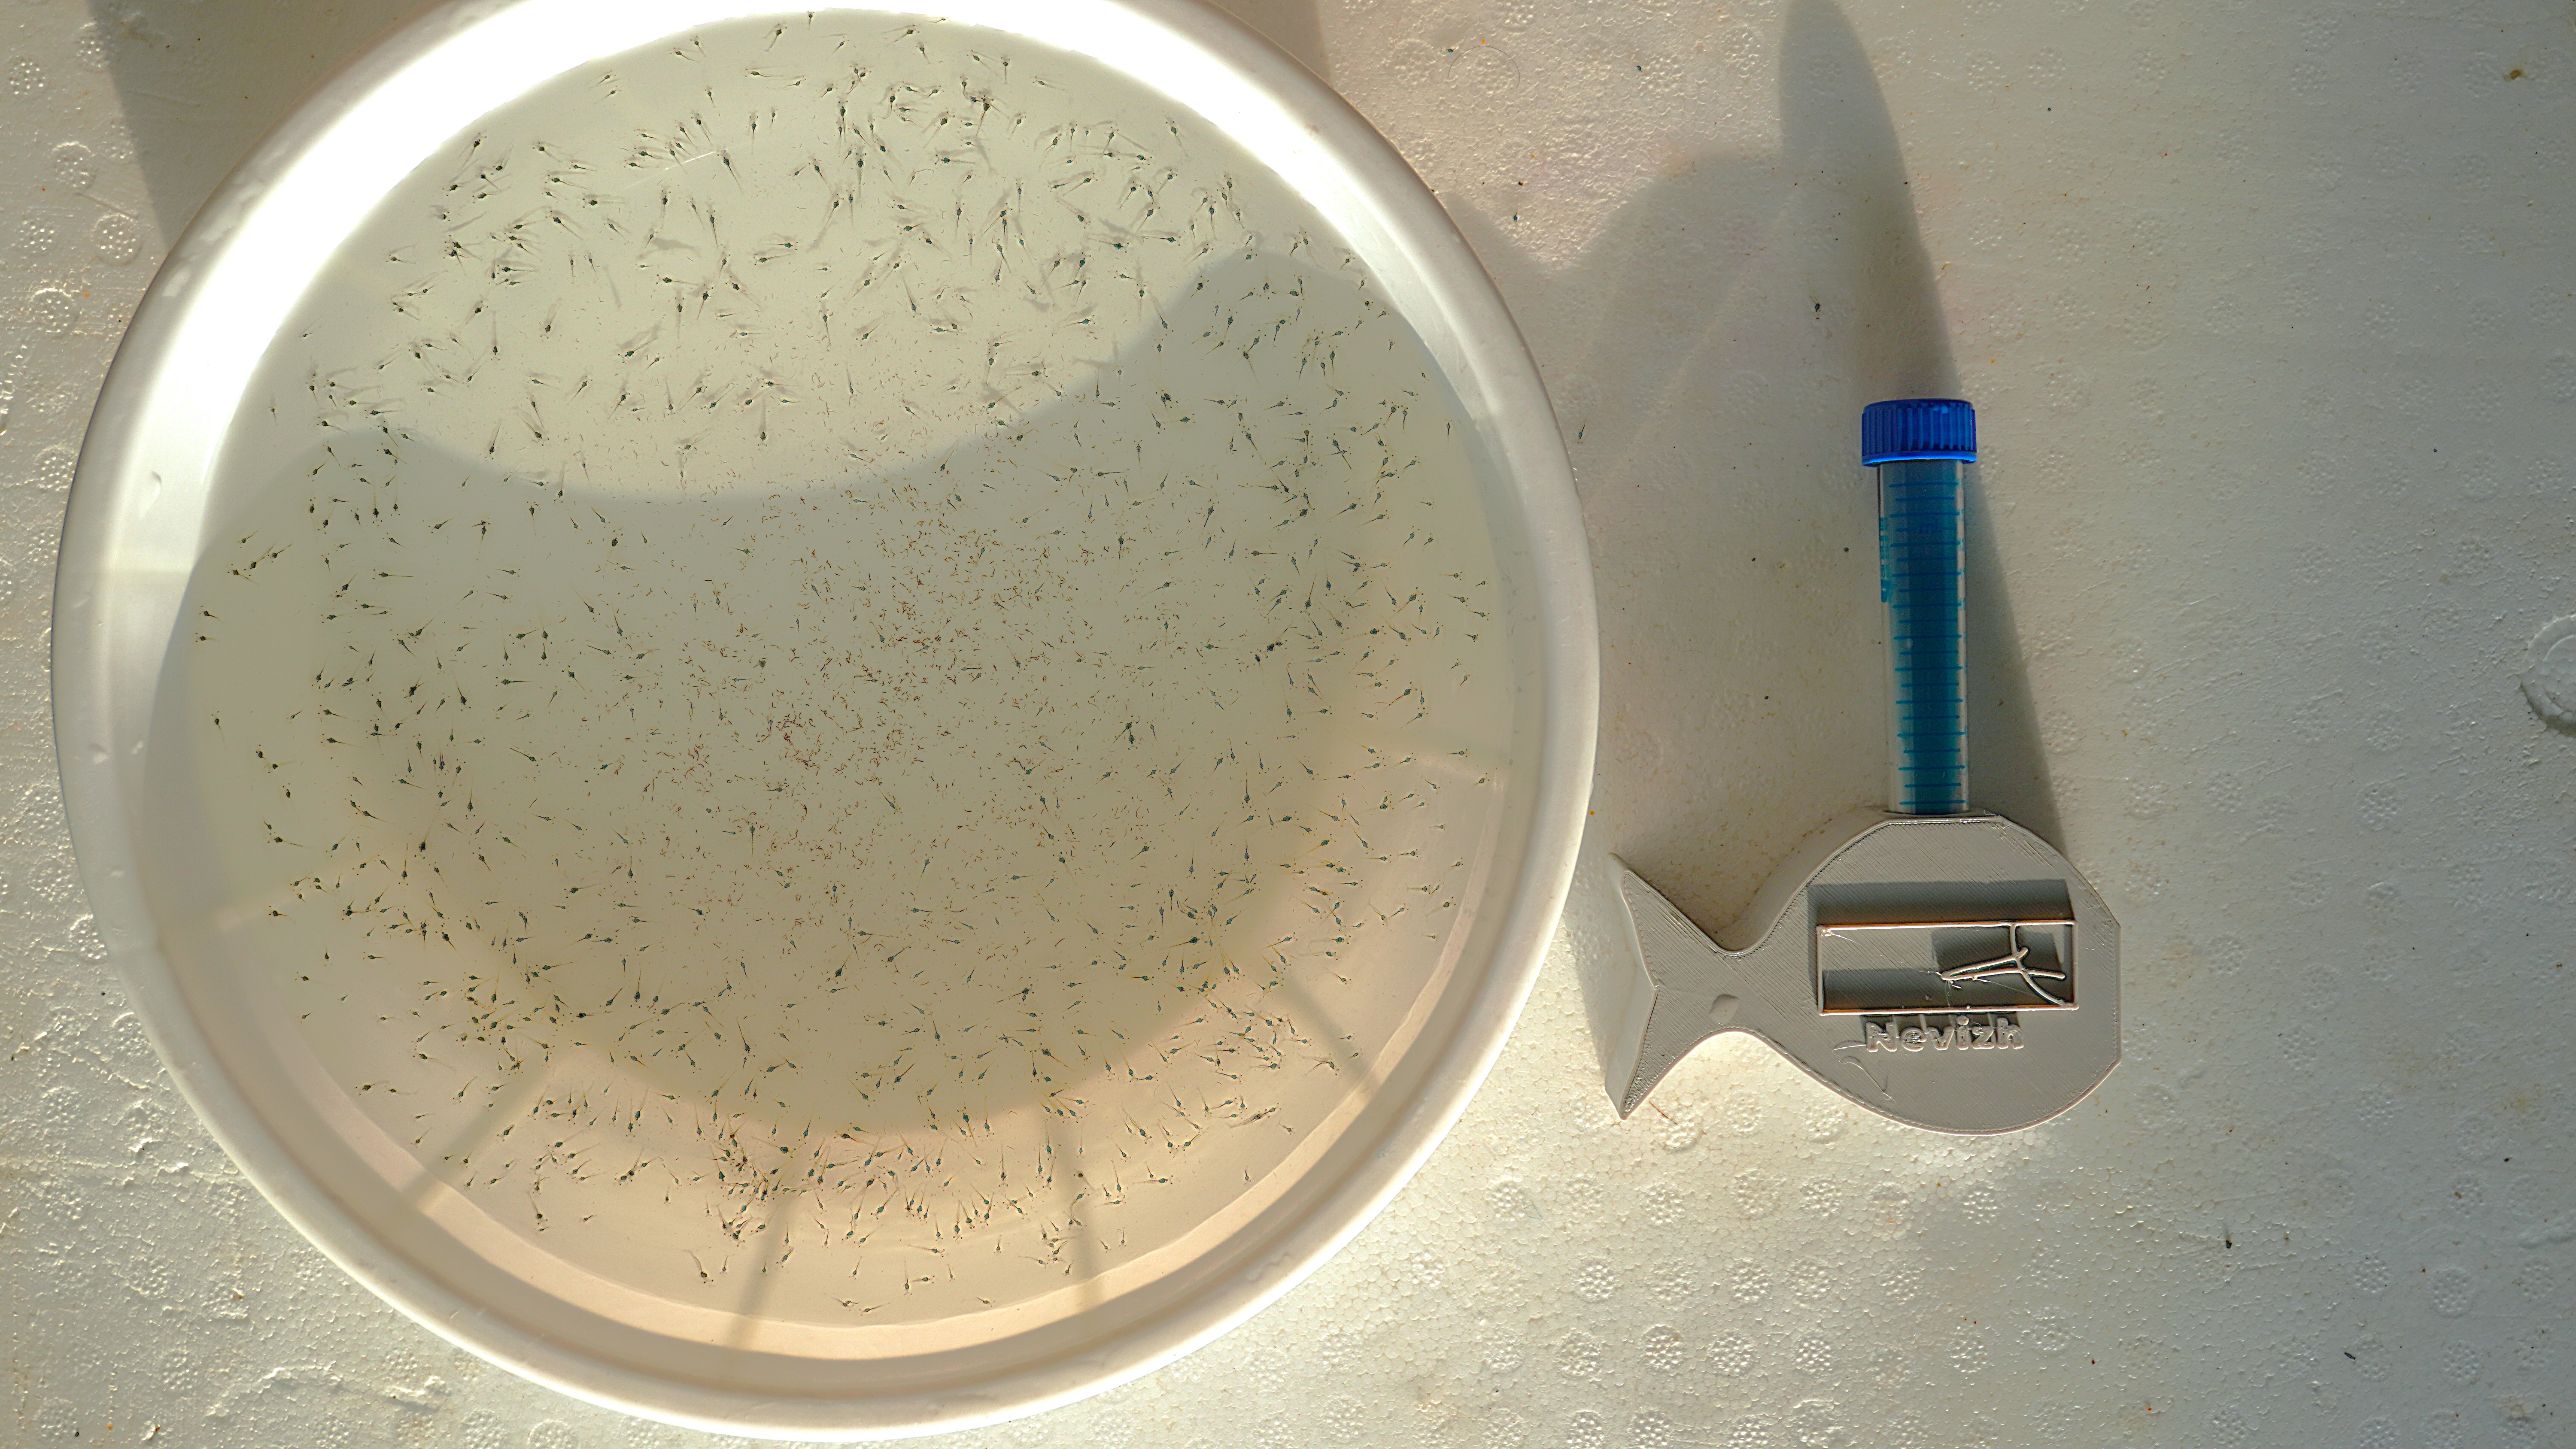
Mysis 1 Hatchery Water – 1 ppm TAN
Water sample taken during the Mysis 1 stage in a hatchery setup, indicating a total ammonia nitrogen (TAN) level reaching 1 ppm.
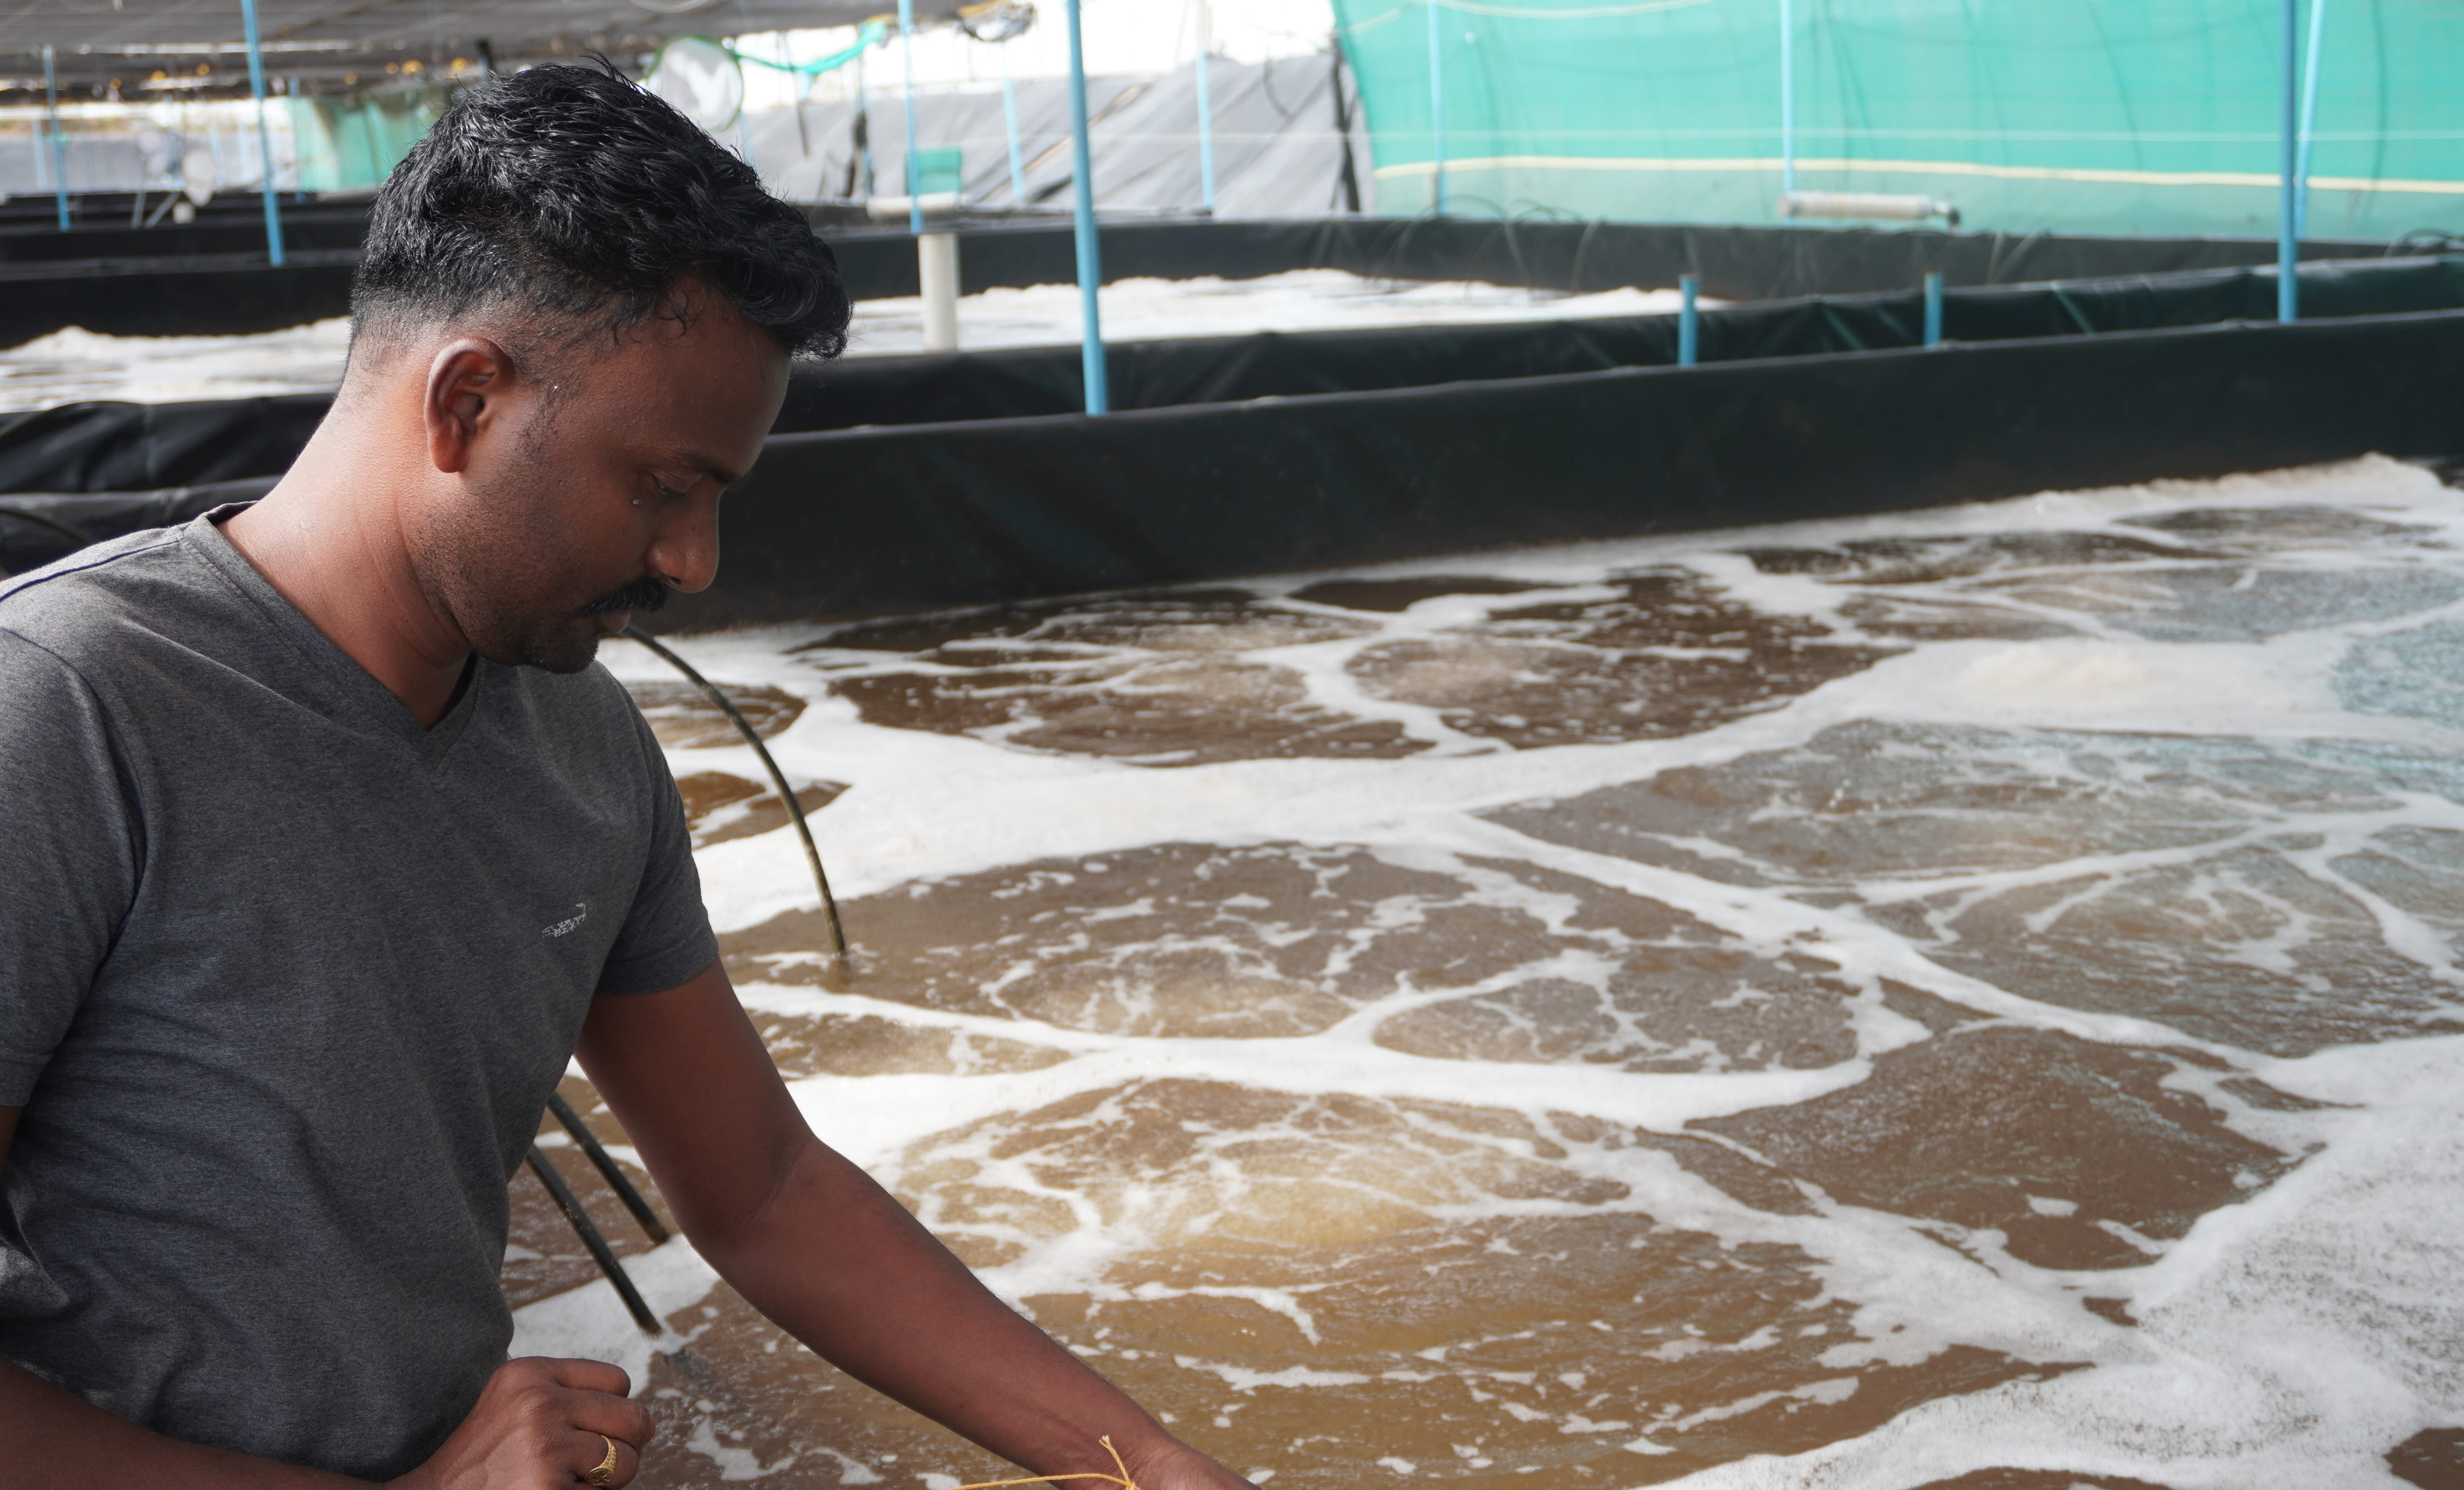
Integrated Nursery Management
Active deployment of HeteroMight®, DriftAct® and VibQuench® in high-density nursery System (5 Animals/L). Demonstrating concurrent Total Ammonia Nitrogen (TAN) regulation and proactive Vibrio pathogen suppression during critical early-stage post-larval rearing.
×
![]()